Overview
Built a scheduled ETL that pulls daily and hourly market data for 31 tickers from Yahoo Finance and loads it into BigQuery. The set covers Colombian listings (BVC shares, NYSE and NASDAQ ADRs, and the COLCAP ETF) and U.S. stocks.
Everything downstream reads the same BigQuery model through a FastAPI service on Cloud Run: a Streamlit dashboard and a chat agent built on the Anthropic Claude API that calls the API’s endpoints as tools.
Approach
Modeled prices as fact tables plus a ticker dimension, so company metadata can change without rewriting price history.
Cleaned and typed the data in pandas before it reaches BigQuery, then loaded it through a temporary table and a MERGE on date and ticker. Running the pipeline twice on the same day doesn’t duplicate rows.
Scheduled the pipeline with GitHub Actions instead of Cloud Scheduler, which keeps the schedule versioned with the code and the run history visible in the repository.
Architecture
Schedule
A GitHub Actions workflow runs the pipeline every day at 22:00 UTC, after the BVC, NYSE and NASDAQ closes, and it can also be triggered manually.
Extract and transform
yfinance downloads daily and hourly bars; pandas renames, casts and drops incomplete rows. A backfill mode loads history from a given date, and hourly history is capped at Yahoo’s limit.
BigQuery model
Daily and hourly fact tables loaded with MERGE, a ticker dimension rewritten from a single source of truth, a metrics table rebuilt in SQL with window functions (daily return, 20-day moving average, 20-day volatility) and two views with Colombia time and ticker metadata.
API layer
FastAPI with 8 GET endpoints over parameterized BigQuery queries and typed response models, packaged with Docker and deployed to Cloud Run.
Dashboard and agent
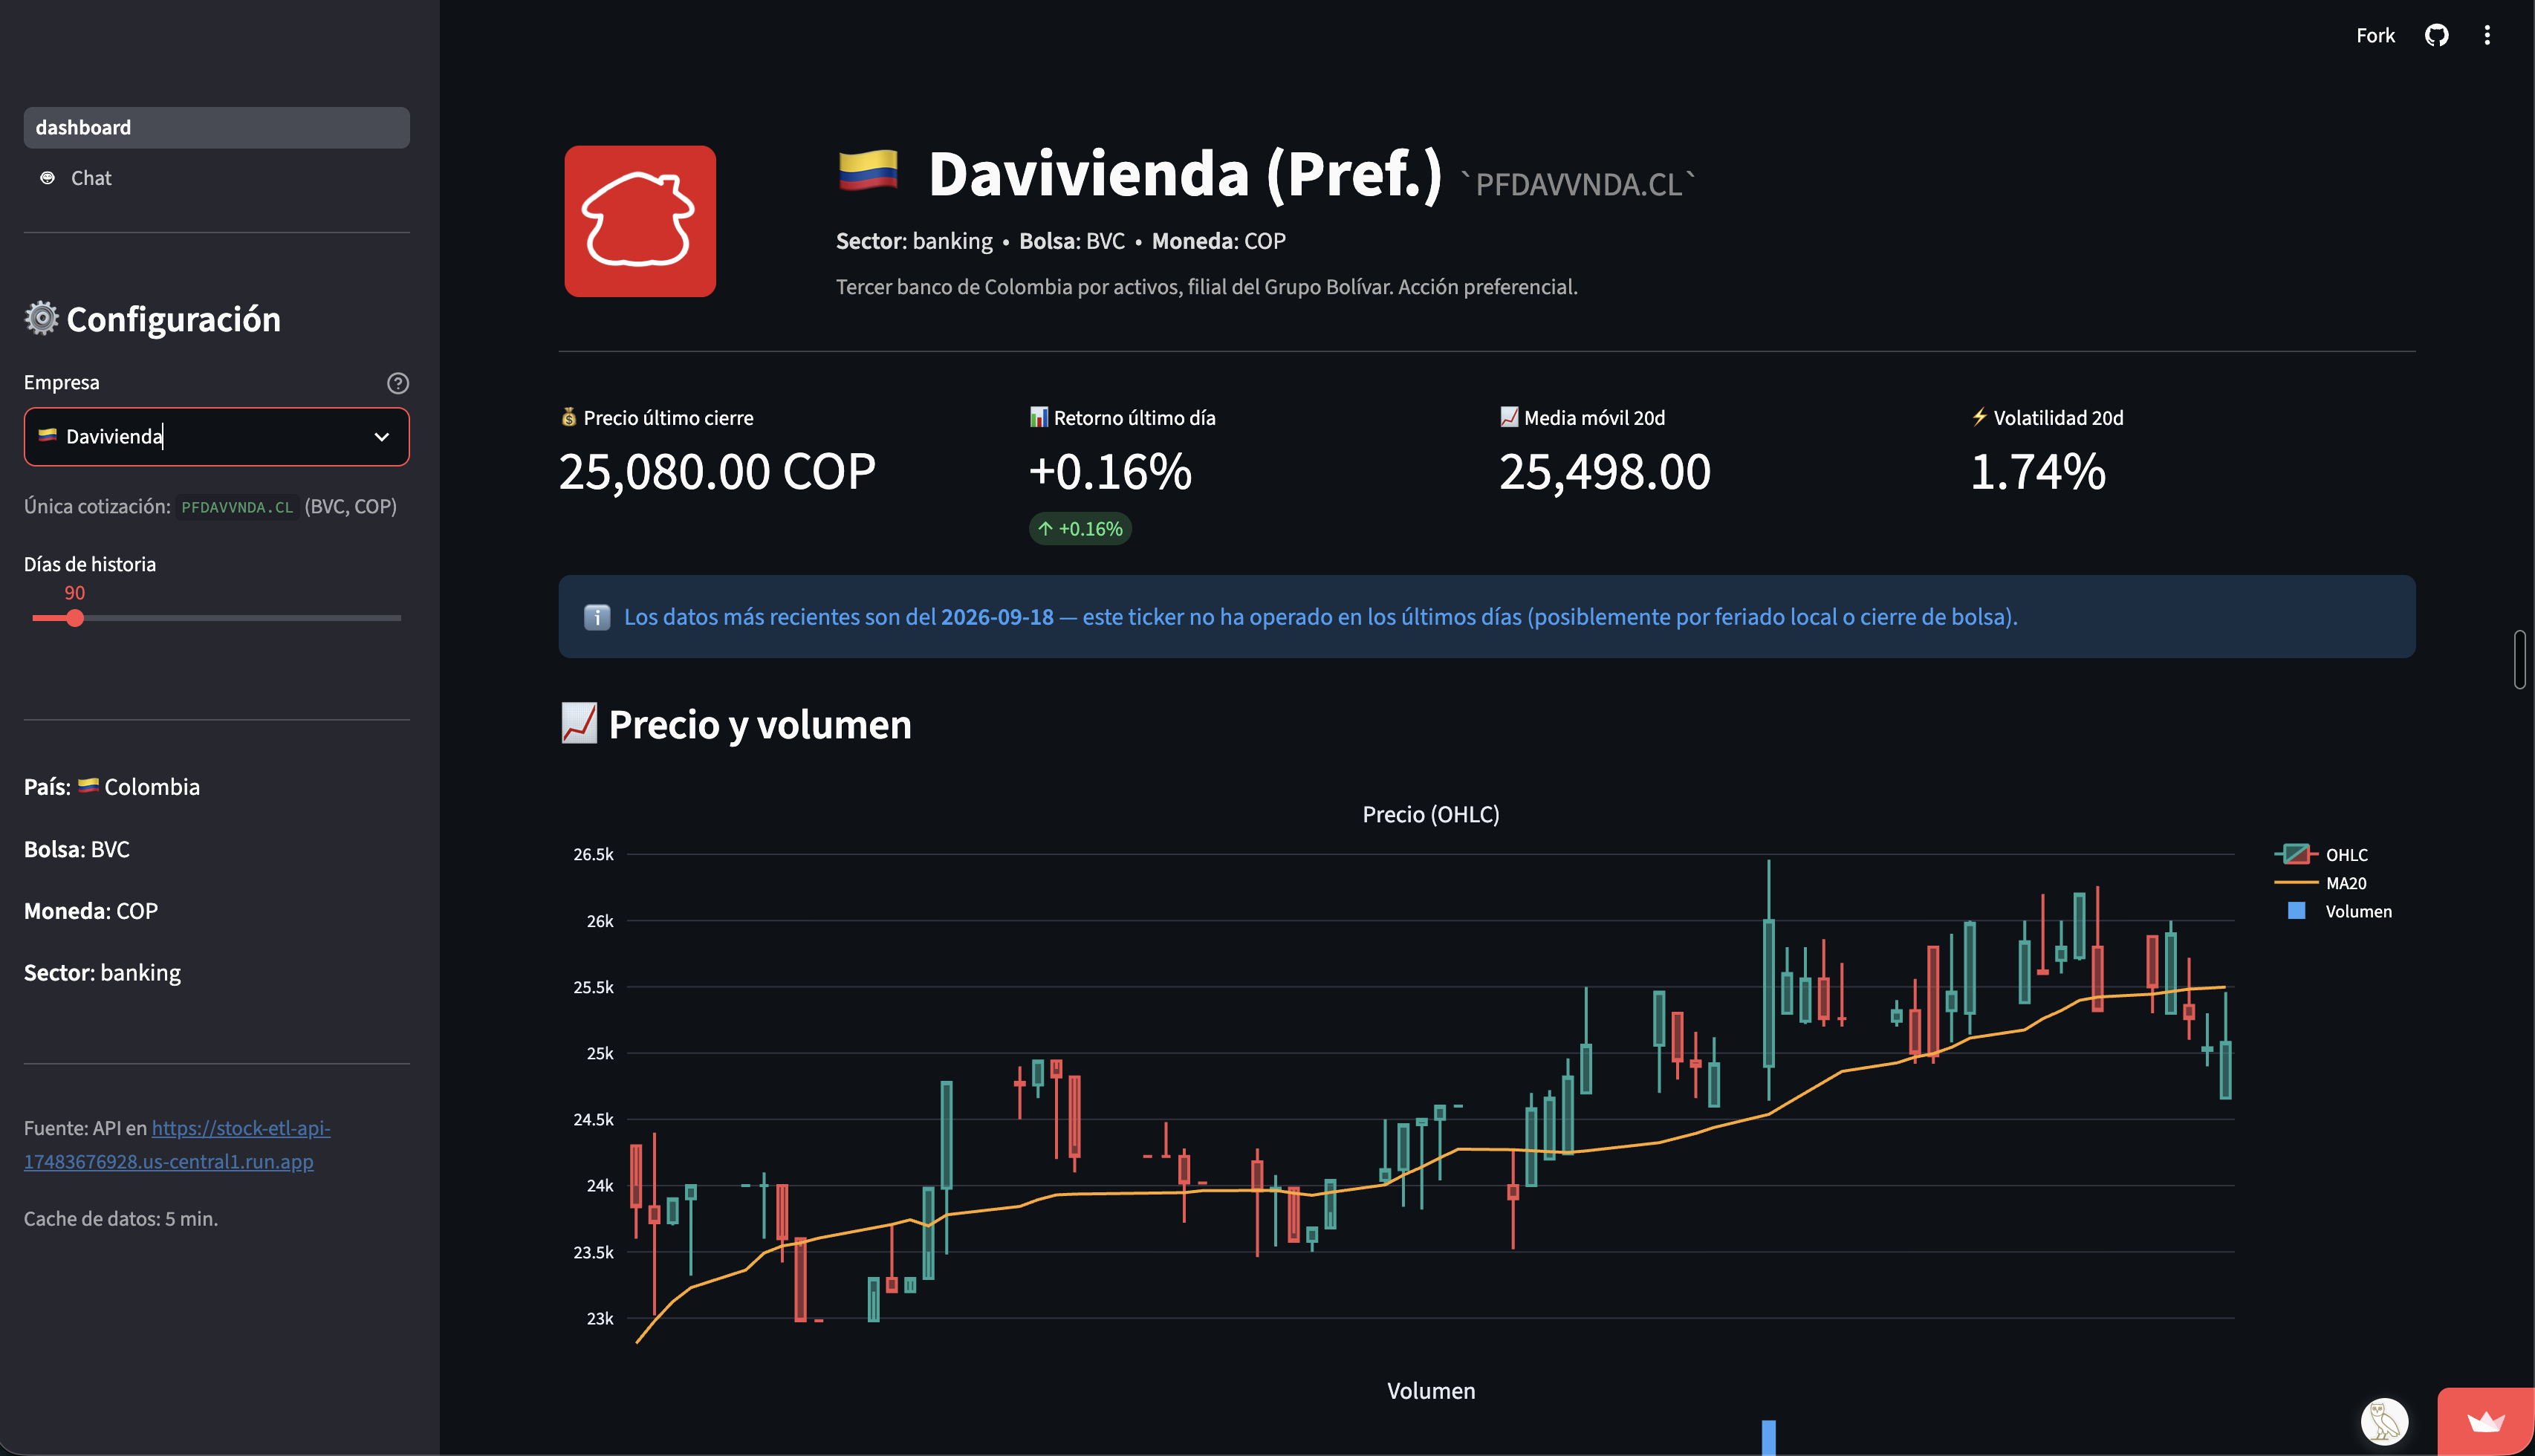
A Streamlit and Plotly dashboard consumes the API: KPIs, candlesticks with a 20-day moving average, volume, intraday data and top movers. A chat page uses Claude with tool use, where each API endpoint is a tool the model can call.
What it covers
- 31 tickers: 24 Colombian listings (BVC shares, NYSE and NASDAQ ADRs, and the COLCAP ETF) and 7 U.S. stocks.
- 4 BigQuery tables and 2 views, loaded by a daily scheduled run.
- 8 GET endpoints: a health check plus tickers, prices, intraday bars, metrics, top movers and a market summary.
Technology
- Python
- pandas
- yfinance
- BigQuery
- FastAPI
- Docker
- Cloud Run
- GitHub Actions
- Streamlit
- Plotly
- Anthropic Claude API
Limitations
- Data comes from Yahoo Finance through yfinance, an unofficial source, and hourly history is limited to roughly the last 730 days.
- Prices mix USD (ADRs and U.S. stocks) and COP (BVC listings), so comparisons need the currency from the ticker dimension.
- There are no automated tests yet.
- The API is public and unauthenticated.
- Staging raw files in Cloud Storage is on the roadmap but not implemented.
Source & implementation
Explore the repository.
Review the code and available project documentation on GitHub.