Overview
Built a Power BI report on a 2021 loan dataset (38,576 records, 24 fields) that moves from portfolio-level KPIs to loan-level records. SQL queries reproduce the report’s KPIs and the aggregations behind its visuals, including month-to-date and month-over-month figures.
Problem
Give business, risk and collections teams one place to monitor loan origination and portfolio quality, and to drill from the overall picture down to individual loans.
Methodology
Summary page
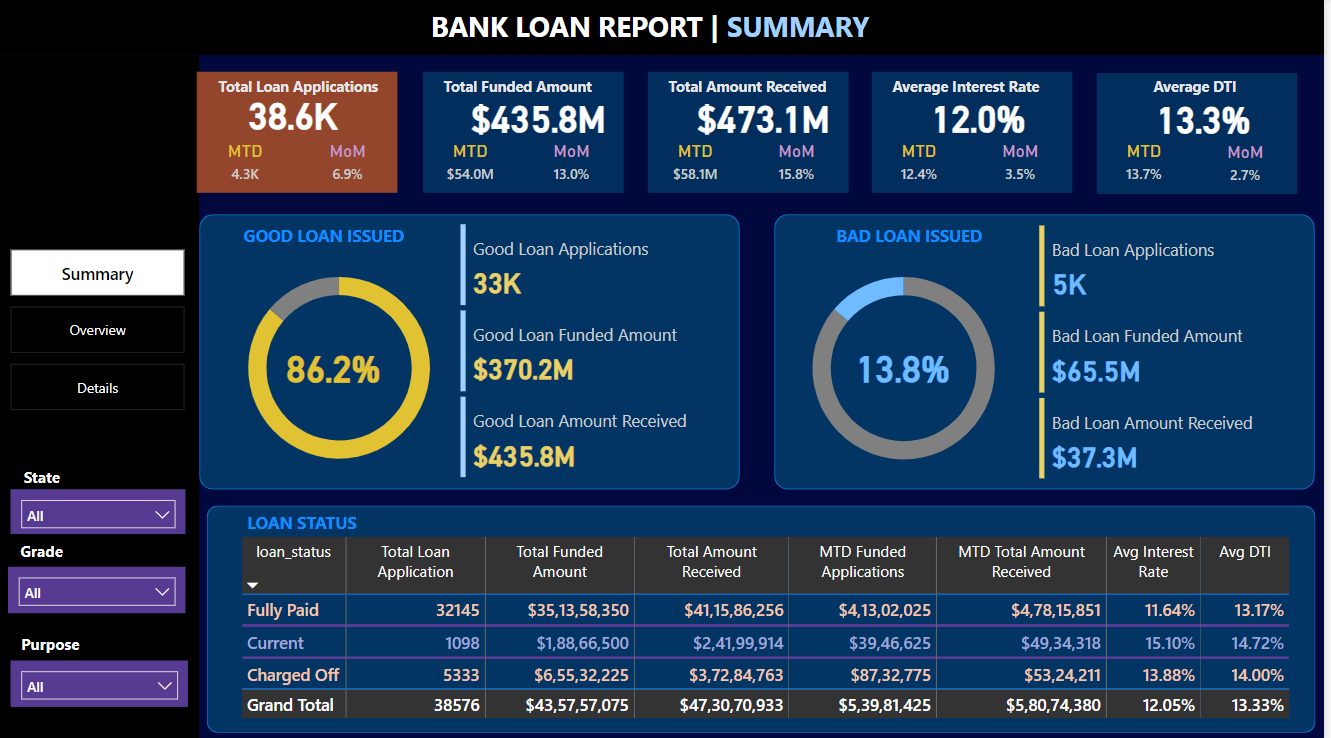
KPIs for applications, funded amount, amount received, average interest rate and average DTI, each with month-to-date and month-over-month values calculated in DAX, plus good versus bad loan breakdowns and a loan-status table.
Overview page
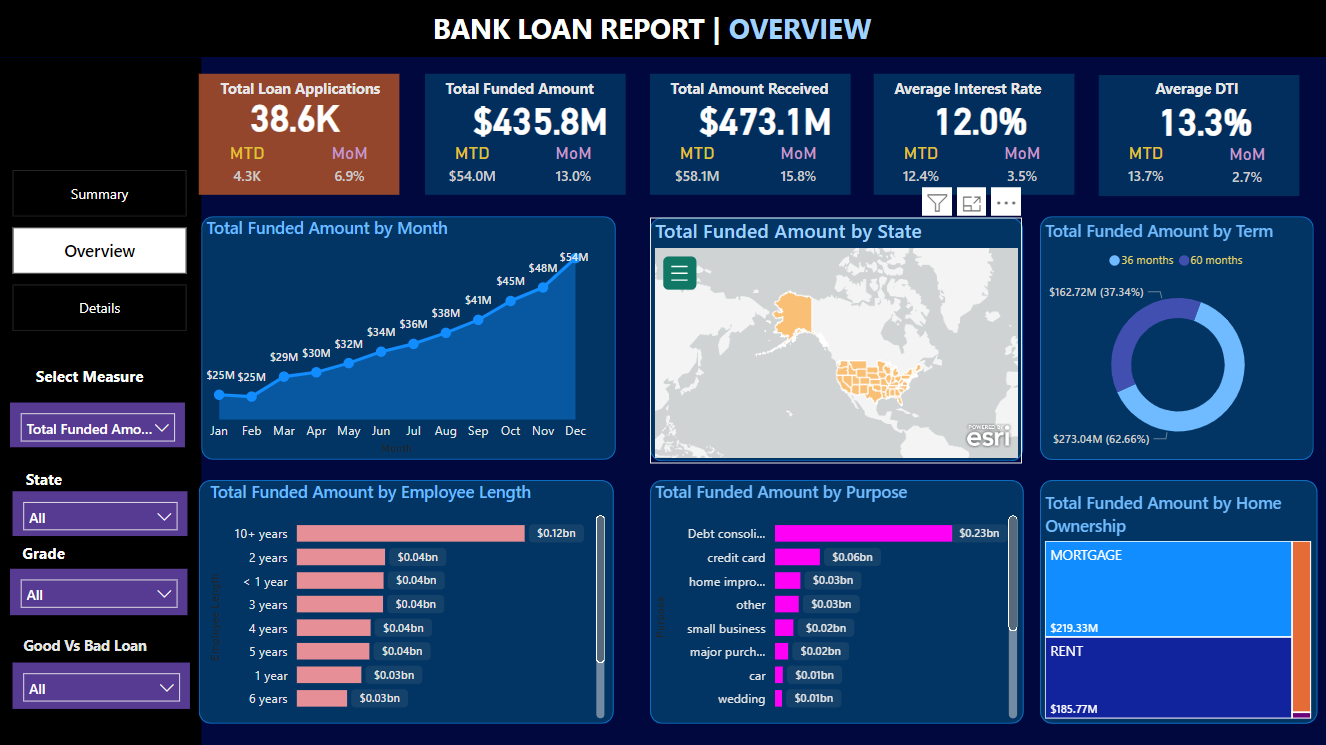
Monthly trends and funded amount by state, term, employment length, purpose and home ownership, with a selector that switches the measure shown.
Details page
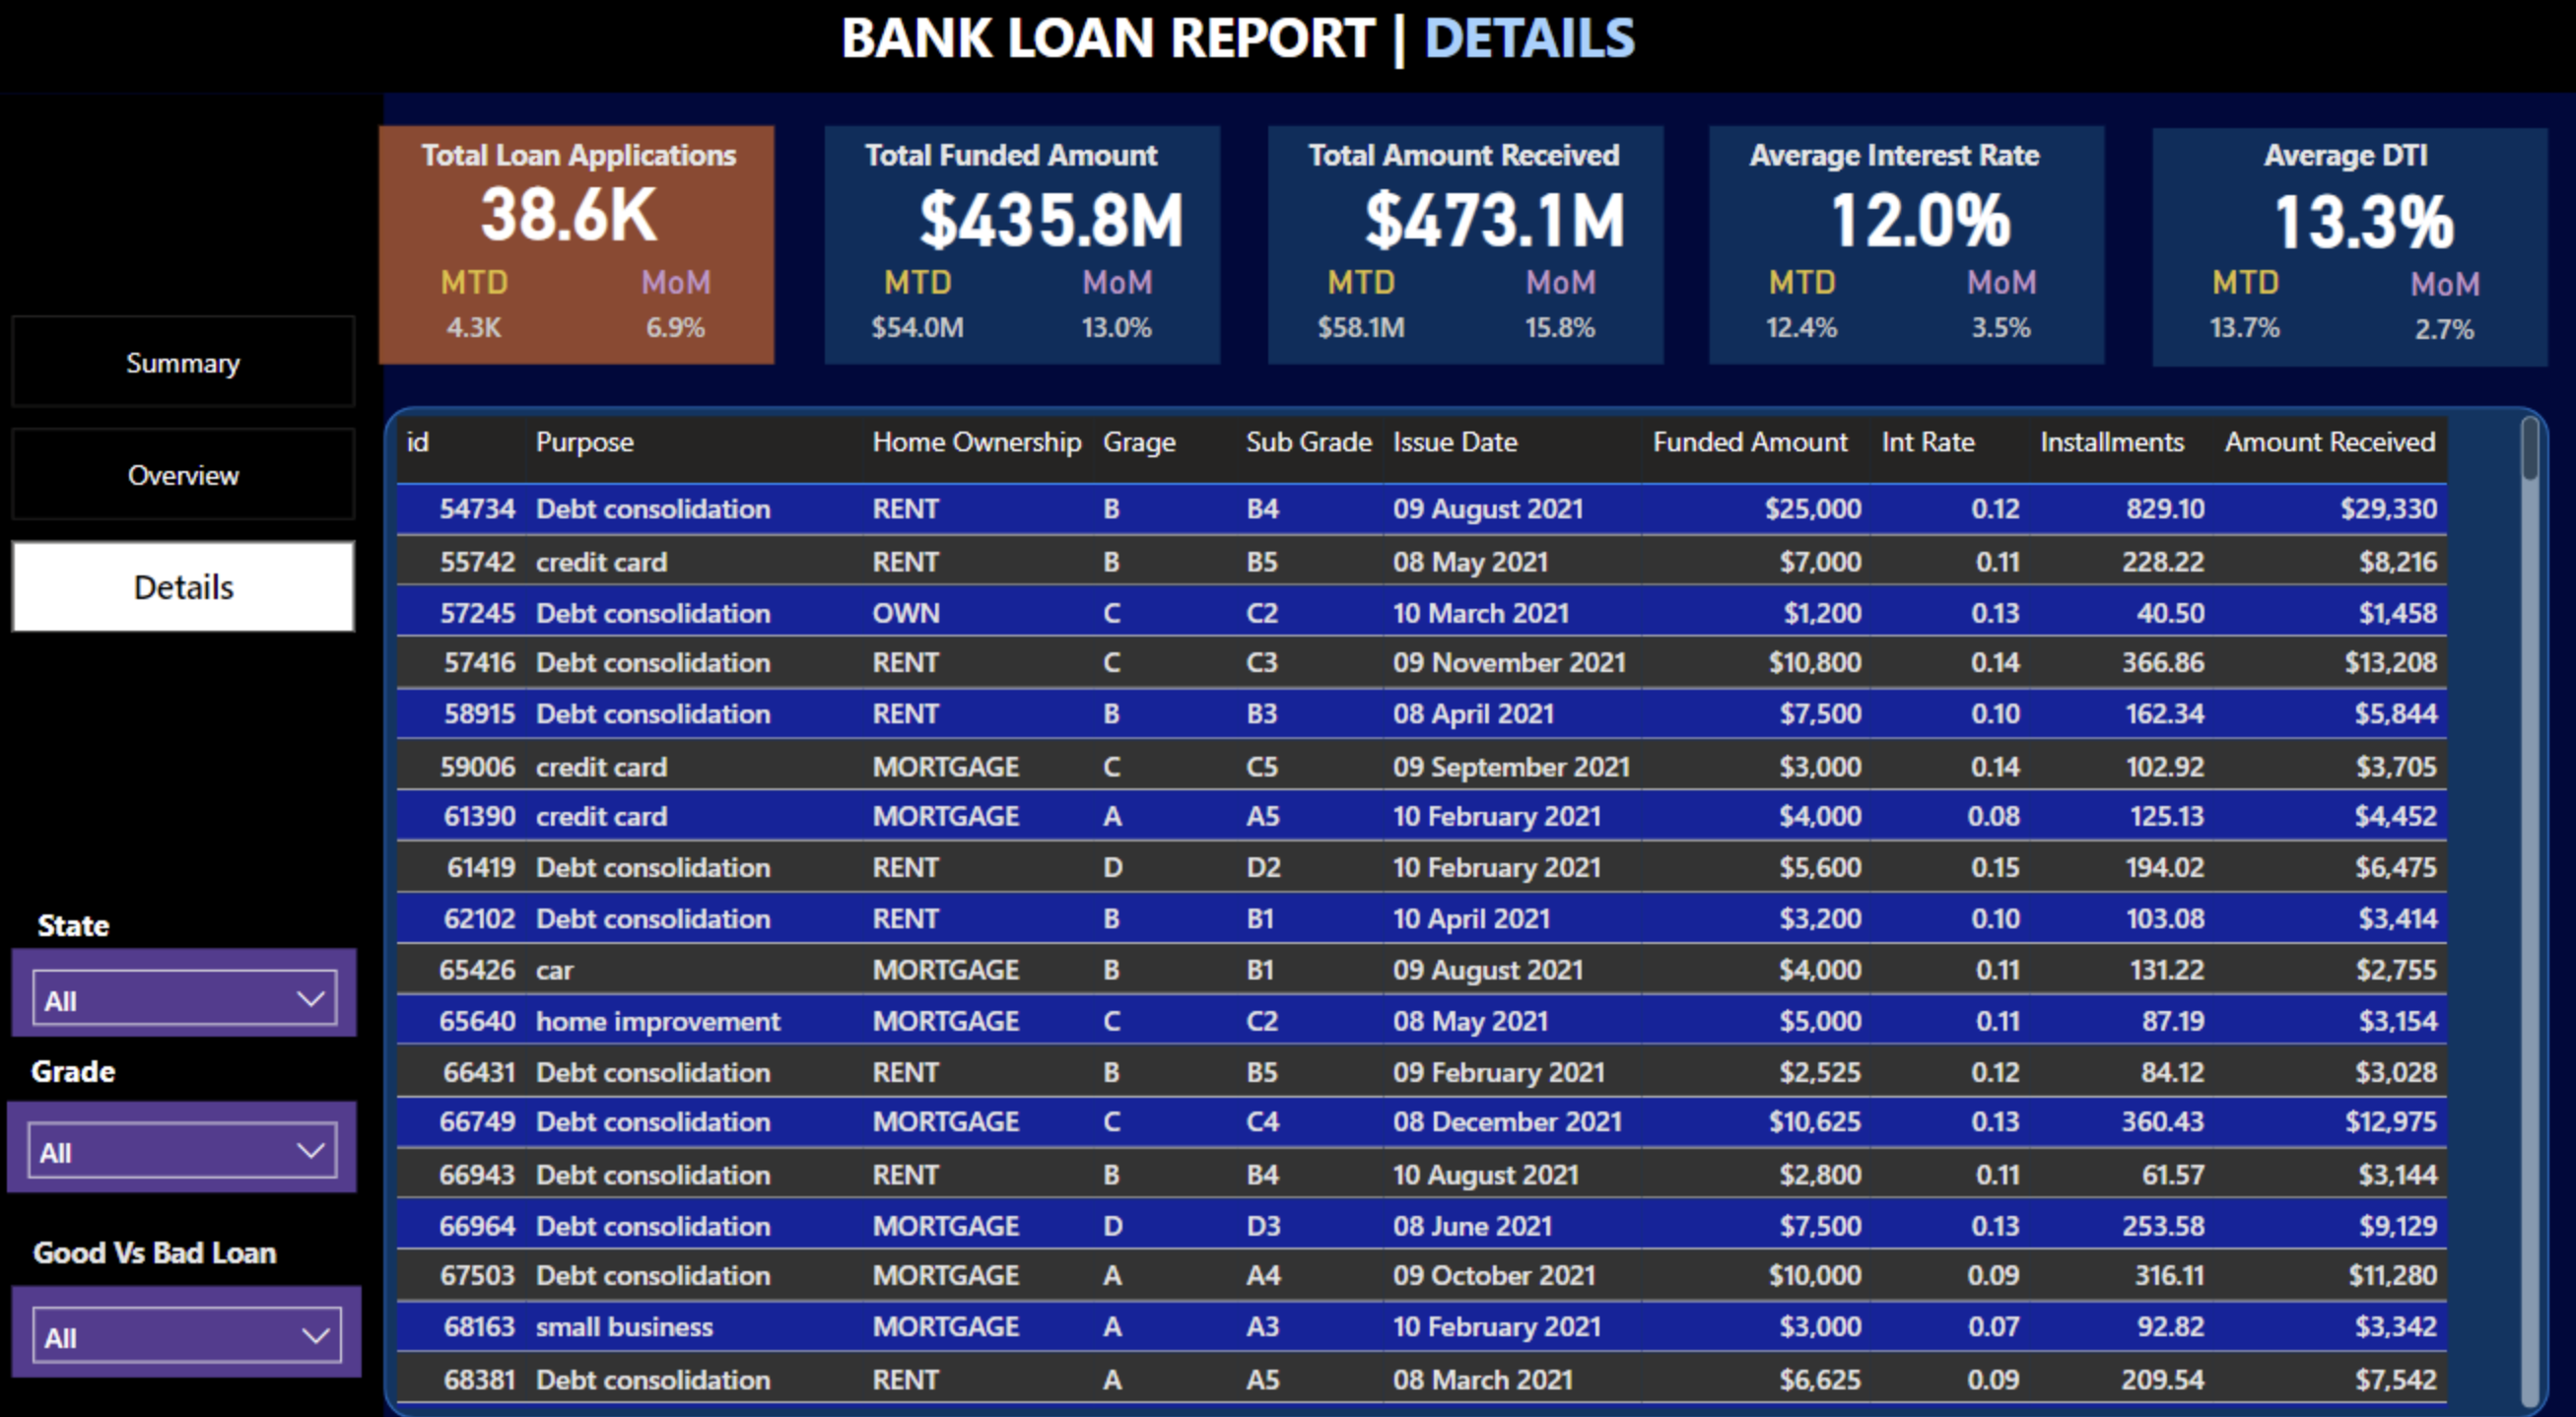
A loan-level table for looking up individual records.
Filters and validation
Filters for state, grade, purpose and good versus bad loans; term, employment length and home ownership appear as breakdown visuals. The SQL file recomputes the KPIs and aggregations used in the report.
Results / Key insights
Amount received is total payments collected, principal and interest included; it isn’t profit. Figures describe the 2021 dataset, not a risk model.
- loan records (2021)
- 38,576
- funded
- US$435,757,075
- received in payments
- US$473,070,933
- average interest rate
- 12.05%
- average debt-to-income ratio
- 13.33%
- good loans (fully paid or current)
- 86.18%
- charged off (5,333 loans)
- 13.82%
- Charged-off loans were funded with US$65,532,225 and received US$37,284,763 in payments.
- The report shows monthly funded amount rising from US$25M in January to US$54M in December.
- 36-month loans account for 62.66% of the funded amount, and debt consolidation is the largest loan purpose.
Technology
- Power BI
- DAX
- SQL
Limitations
- One year of data (2021).
- Descriptive reporting only: there is no predictive risk model and no causal conclusion.
- Amount received includes principal and interest, so it doesn’t measure profitability.
- The emp_title field has 1,433 missing values.
Source & implementation
Explore the repository.
Review the code and available project documentation on GitHub.